Best Ultra Short-Term Bond ETFs (Updated October 2022)
For most income investors, 2022 has been a year they'd like to forget. Not only has it been a bad year, it's been historically bad. The iShares 20+ Year Treasury Bond ETF (TLT) is down 36% year-to-date. This quote might sum it up best.
This year is the most devastating period for bonds since at least 1926, the numbers show. And, in the estimation of one bond maven, 2022 is shaping up to be the worst year for bonds since reliable record-keeping began in the late 18th century.
Ouch! If it wasn't bad enough that fixed income investors had to deal with years of 1% yields, now they've been forced to watch the absolute decimation of their bond portfolios on top of it. It's probably been the worst bond market in financial markets history. On top of that, the Fed is still raising interest rates and those miserable returns might actually get worse before the year is through.
Investors haven't abandoned fixed income ETFs though. On the contrary, this group has attracted more than $137 billion in net inflows year-to-date. That's not necessarily as surprising as it might sounds since ETFs have been seeing hundreds of billions of dollars of inflows for several years now and this is just a byproduct of regular saving and investing. Plus, it's not like stocks are providing any kind of attractive alternative.
Where that money is going, however, has shifted. While there is money still going into all durations of fixed income, the largest relative flows are going to ultra short-term bond ETFs. In fact, this group just had its best month of inflows and it's not even close.
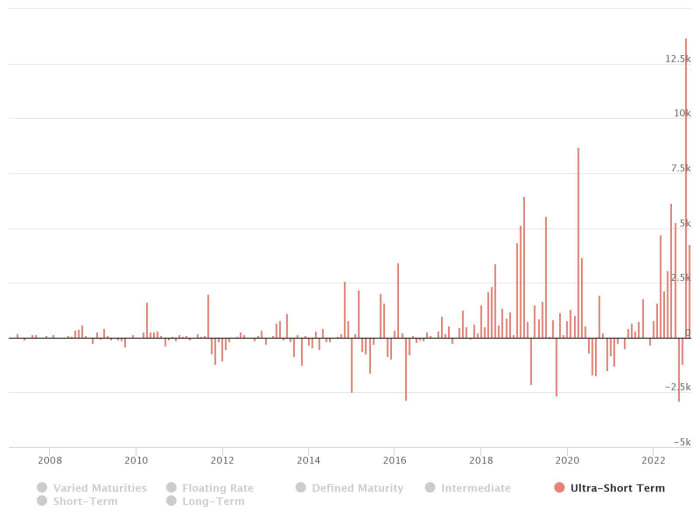
Ultra Short-Term Bond Flows by Month (source: ETF Action)
To give you a sense of how much interest has been generated by ultra short-term bond ETFs, they account for just 8% of all bond ETF assets, but more than 27% of net flows this year. Investors are still putting their money into fixed income, but they're favoring doing it in the most conservative way possible.
When you think of ultra short-term bonds, you should think of things, such as Treasury bills, floating rate notes or any other bond that has a remaining maturity of one year or less. The durations of these funds are typically anywhere from 0.5 to 1 years, meaning that for every 1% increase in interest rates, they can be expected to decline in value by 0.5% to 1%. Floating rate funds may have a duration next to zero. From a risk perspective, these are about the least volatile bond products you can find.
I think these ETFs can be ideal as cash alternatives in a portfolio. They're not money market funds, but they're just one step above them. For comparison's sake, the Vanguard Federal Money Market Fund (VMFXX) yields about 2.8%, but the Vanguard Ultra-Short Bond ETF (VUSB), which we'll see on this list in a minute, yields 4.2%. In my opinion, that yield boost is more than worth the modest bit of extra risk you take from going this route.
Ranking The Ultra Short-Term Bond ETFs
The variety of ETF choices makes distinguishing the best from the rest a little challenging. You've probably heard most financial pundits talk about focusing on funds with low expense ratios. That can certainly be a big factor in deciding which ETF to go with (it's probably the most important factor, in my view), but there are a lot of things that could go into making the right choice.
That's where I'm going to try to make things easier for you. Using a methodology that I've developed, which takes into account many of the factors that should be considered and weighting them according to their perceived level of importance, we can rank the universe of available ETFs in order to help identify the best of the best for your portfolio.
Now, this certainly won't be a perfect ranking. The data, of course, will be objective, but judging what's more important is very subjective. I'm simply going off of my years of experience in the ETF space in helping investors craft smart, cost-efficient portfolios.
Methodology & Factors For Ranking ETFs
Before we dive in, let's establish a few ground rules.
First, all of the data is used is coming from ETF Action. They have gone through the ETF universe to identify and categorize those ETFs used here. There are many that qualify and we'll be using their categorization as a starting point. Many thanks to them for opening up their vast database for my use.
Second, let's run down the factors I used in the ranking methodology.
- Expense Ratio - This is perhaps the most important factor since it's the one thing investors can control. If you choose a fund that charges 0.1% per year over a fund that charges 1%, you're automatically coming out ahead by 0.9% annually. You can't control what a fund returns, but you can control what you pay for the portfolio. Lower expense ratios equal more money in your pocket.
- Spreads - This relates to how cheaply you can buy and sell shares. Generally speaking, the larger the fund, the lower the spreads. Bigger funds usually have many buyers and sellers. Therefore, it's easier to find shares to transact and that makes them cheaper to trade. On the other hand, small funds tend to trade fewer shares and investors often need to pay a premium to buy and sell. Considering expense ratios and spreads together usually give you a better idea of the total cost of ownership.
- Diversification - Generally speaking, the broader a portfolio is, the better chance it has at reducing overall risk. A fund, such as the Energy Select Sector SPDR ETF (XLE), provides a good example. 45% of the fund's total assets go to just two stocks - ExxonMobil and Chevron. By buying XLE, you're putting a lot of faith in just those two companies. An equal-weighted fund, such as the Invesco S&P 500 Equal Weight Energy ETF (RYE), would score higher on diversification than XLE.
- FactSet ETF Scores - FactSet calculates its own proprietary ETF ranking for efficiency, tradeability and fit. They basically are designed to tell us if an ETF is doing what it sets out to do. I'm not going to copy and paste that work that they're doing, but there is some influence there to make sure my rankings are on the right path.
There are a few other minor factors thrown into the mix, but these are the main factors considered.
One thing that is not considered is historical returns. Most ETFs are passively-managed and are simply trying to track an index, not outperform. ETFs shouldn't be penalized for low returns simply because the index they're tracking is out of favor at the moment.
I'm ranking ETFs based on more basic structural factors. Are they cheap to own? Are they liquid? Do they minimize trading costs? Do they maintain risk-reducing diversification benefits?
Being in the bottom half of the list doesn't automatically make a fund "bad". It simply means that due to a low asset base, a high expense ratio, a concentrated portfolio or some other factor, it poses additional costs or downside risks.
Best Ultra Short-Term Bond ETF Rankings
With two dozen different ETFs falling into this category, these rankings look almost entirely based on the expense ratio. Within this group, there are three heavyweights and several others maintaining $1 billion+ asset bases.

Let's talk those big three first - the SPDR Bloomberg 1-3 Month T-Bill ETF (BIL), the iShares Short Treasury Bond ETF (SHV) and the JPMorgan Ultra-Short Income ETF (JPST).
BIL is pretty much a straight T-Bill ETF. It's 100% government securities with maturities between 1-3 monthsshy etf. It's about as safe a fixed income ETF as you'll find out there. SHV is a minor step up from BIL. It invests in Treasuries with remaining maturities of less than a year, so interest rate risk is a bit higher, but not so much that you see a significantly different risk profile. JPST is more of a "go anywhere" bond ETF, but it typically focuses on investment-grade corporate bonds with a tilt towards financials. It'll also dip down into bonds rated as low as BBB, so the risk profile is definitely different. Interest rate risk is modestly higher and you begin introducing credit quality risk to the equation.
Of the three, SHV may be the better choice for this moment at least. It yields 0.5% more than BIL with very little additional risk. I hesitate with JPST because there's no real yield advantage, but it does come with higher risk. Plus, credit risk hasn't really been priced into the bond market. It's all been a broad shift higher in the entire yield curve. Once credit spreads increase, corporate bond ETFs, such as JPST, could underperform.
The #1 spot in these rankings goes to the iShares 0-3 Month Treasury Bond ETF (SGOV), which is basically BlackRock's answer to BIL. Undercutting on price with its expense ratio that's only about 1/3 that of BIL's helps push it up to the top. With $5 billion in assets, it's more than liquid enough to keep trading costs next to nothing.
The ETF coming in at #2 is a bit of an upset - the BondBloxx Bloomberg Six Month Target Duration U.S. Treasury ETF (XHLF). BondBloxx debuted its first ETFs only in February of this year, a suite of sector-focused high yield bond ETFs. It followed up with another suite of high yield bond ETFs targeting specific credit ratings. XHLF is part of the issuer's latest group of bond ETFs investing in very specific durations of U.S. Treasuries. This latter group is particularly interesting because they all come with expense ratios of 0.08% or less. XHLF is the cheapest of the bunch at 0.03%, the primary factor that puts it near the top of the list. The relatively tiny asset base usually results in higher trading costs, something that will impact ETFs negatively in these rankings, but spreads are already surprisingly tight.
Elsewhere, the U.S. Treasury 3 Month Bill ETF (TBIL) is a single bond ETF that holds just the most recent 3-month T-Bill issue. It'll hold that bond until the next 3-month T-Bill gets issued, at which time the fund will roll forward to the new note. TBIL is designed to maintain a very specific tenor as opposed to many bond ETFs that target a range of maturities.
Vanguard usually lands near the top of most ETF ranking categories based on their low fee offerings and this one is no exception. The Vanguard Ultra-Short Bond ETF (VUSB) lands at #5. VUSB is Vanguard's first actively-managed bond ETF and invests primarily in investment-grade corporate bonds. Like JPST, it's exposed to credit quality risk and does have about 1/3 of the portfolio dedicated to BBB-rated bonds. Risk is a little higher here, about 50% more volatility than JPST based on credit ratings and durations.
Read More…
QQQ vs. QQQM vs. QQQJ: What To Expect From The Big 3 Nasdaq ETFs
VTI vs. ITOT: Comparing The Vanguard & iShares Total Market ETFs