Apple Q4 Earnings: Countdown Begins, Here Are The Key Numbers
Thursday, October 20: we are exactly one week away from Apple’s September quarter earnings day. Today, the Apple Maven talks about some of the key metrics to pay attention to, as we begin our countdown with a series of daily earnings preview articles.
Will Apple stock (AAPL) - Get Free Report react positively to fiscal Q4 results and holiday season outlook, finally leaving the bear market behind and heading closer to peak levels?

Figure 1: Apple Q4 Earnings: Countdown Begins, Here Are The Key Numbers
Read more from Apple Maven: Apple Is Having Another iPhone Mini-Like Problem
Apple’s headline numbers
An earnings report will usually attract the attention of analysts and investors first on two key metrics: revenues and earnings per share. On the latter, consensus suggests that EPS will land at $1.27, a figure that is only a few pennies above last year’s number.
On the former, Apple is expected to deliver $88.9 billion for year-on-year growth of nearly 7%. Despite being single digits only, the sales increase over 2021 is not too bad, considering the very tough comps that were probably boosted temporarily by pandemic-driven demand.
If Apple delivers 7% in revenue growth this time, the annualized fiscal Q4 growth rate since the comparable pre-pandemic period will have been a quite respectable 12%. The number could have been better, if not for FX headwinds that should be sizable this time. See the graph below.

Figure 2: Apple's total revenue growth per quater since 2019.
DM Martins Research
Revenue is exactly what Apple has refrained from guiding since the start of the COVID-19 crisis, and the one key metric whose consensus estimate is most susceptible to being wrong. Further down the P&L, Apple’s executive team projected the following during the Q2 earnings call:
- Gross margin: between 41.5% and 42.5%
- Operating expense: between $12.9 billion and $13.1 billion
- Other income and expenses: around negative $100 million
- Tax rate: around 16%.
Not guided above, in addition to revenues, is share count. But assuming the recent trend in share retirement (see graph below), it is fairly safe to assume that shares outstanding will hover around 16 billion.

Figure 3: Apple's diluted shares per quarter since 2019.
DM Martins Research
What Apple’s FQ4 P&L may look like
Assuming the consensus revenues and share count estimate mentioned above, I have put together Apple’s expected FQ4 P&L below, alongside last year’s FQ4 results.
Keep these numbers in mind when assessing the Cupertino company’s performance. Upside to this benchmark, in addition to guidance for the holiday period, could be crucial in determining which way Apple stock price might head in after-hours trading, on earnings day.

Figure 4: Projected P&L vs. last year.
DM Martins Research
Here are a few interesting observations about Apple’s projected income statement above:
- Growth in gross profit that is lower than the increase in sales suggests gross margin compression. This could be mainly due to unfavorable foreign exchange movements.
- Operating expenses should increase at about twice the pace of revenues. Regarding these costs, CEO Tim Cook has recently mentioned that Apple “believes in investing through the downturn [and will] continue to hire people”.
- Last year’s Q4 effective tax rate landed south of 12%, much lower than the 16% projected this time.
- Apple’s net income is actually projected to dip slightly YOY. The main reason why EPS will grow instead, by 3%, is the decrease in diluted share count – I talked about this phenomenon in detail a while back.
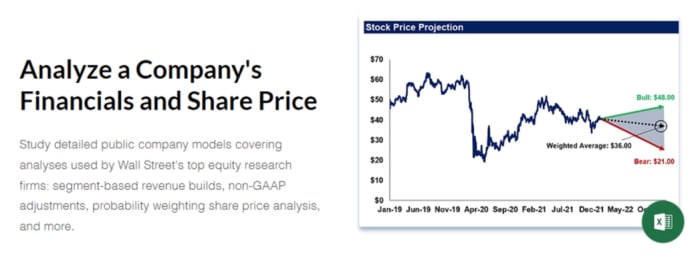
Land a Top Equity Research Job with Peak Frameworks
Equity research is a great career path that combines deep industry analysis and financial modeling, while exposing you to the strategic frameworks of many different types of investors in the stock market.
Many students have used the Peak Frameworks Equity Research course to break into the industry out of school, or to transition into the field from a non-finance career path. The lead instructor has experience working at Goldman Sachs and J.P. Morgan and was involved in the recruiting process at both banks, so you’ll get a comprehensive view of the skills you need to get and prepare for an interview.
To learn more, click on this link and use the code APPLEMAVEN10 for 10% off the course.
(Disclaimers: this is not investment advice. The author may be long one or more stocks mentioned in this report. Also, the article may contain affiliate links. These partnerships do not influence editorial content. Thanks for supporting the Apple Maven)